The graph above demonstrates alignment constraints and non-overlapping group and node boundaries. The groups highlight and keep separate specific functional partitions in the pathway. Four alignment constraints are used to arrange nodes involved in the cycle around the edges of a rectangle. To biologists, cycles in these types of pathways are very important because they represent continuous processes. Another alignment is used to straighten one particular path inside the green group.
The image below is drawn by hand by a biologist with data from the Kegg Pathway Database. Constraints allow us to capture in a live, automatically adjusting layout, the same kinds of drawing conventions that biologists (and others) like to see in textbook drawings of their networks.
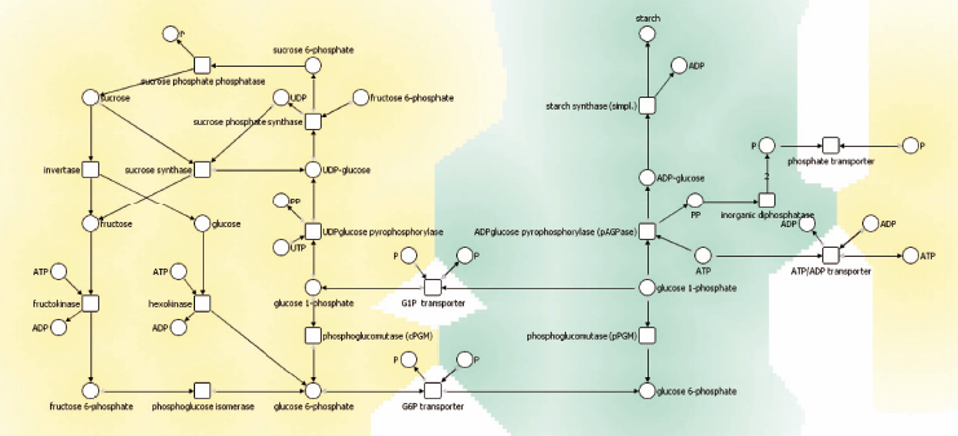
The SVG diagram below is used as the source for the nodes, edges and constraints used in the CoLa layout above. It was originally authored in the Dunnart constraint-based diagram editor. Dunnart is great for interactively authoring the constraints and creating a semi-supervised layout, but obviously web-based constraint layout is easier to deploy! Have a look at the source of this page to see how to extract the graph and constraints from the Dunnart generated SVG.